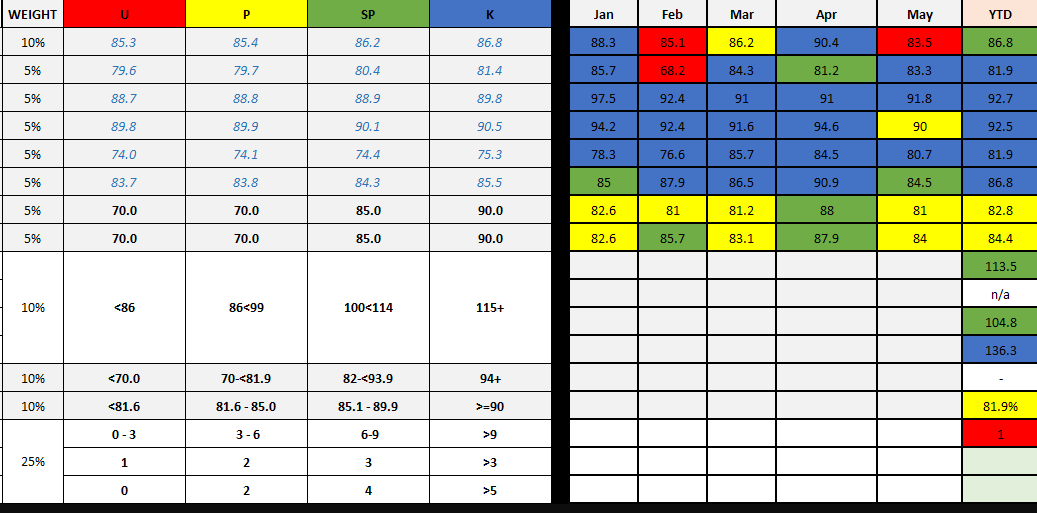
In this balance scorecard one can make dicision faster. This will show many KPI indicator with differnet measurs. Based on color one can easity identify where the problem is or which one is really doing great.
Related Posts
Timeline Visual in Excel
All projects activity shown here. This can be filtered by date wise and other filered wise too. Here I use…
Excel Dashboard
Sales KPI Metrics Dashboard Lorem Ipsum has been the industry’s standard dummy text ever since the 1500s, when an unknown…
Excel Dashboard can do Magic
Excel dashboard can do magic. Education Excel dashboard can do magic if it is used in a perfect way Education…